Align AI Spend With What Matters
See exactly how AI and engineering effort maps to the initiatives you care about, so leaders can confirm investment is flowing to the highest-priority work, not just the loudest.
When writing is free, volume stops being an achievement. Behold measures the judgment behind the work: what it costs you to keep the slop, and where a person is still the most valuable thing in the room. All of it in $$$.
Reads from the systems you already run
Both of these are accurate. One of them is what your tooling reports and what gets taken to the board. The other is what the quarter actually cost you.
Pull requests merged
vs. same quarter last year
Throughput per engineer
sustained over 11 weeks
AI adoption
of engineers, weekly active
Cost per merged PR
spend down, output up
Nothing here is wrong. Every number is real, and every tool you already run will show you some version of it.
Merged work rewritten within 90 days
up from 9%
Review time per reviewer
the cost moved, it did not vanish
Changes no author could explain
sampled at review
Cognitive complexity
compounding, not transient
None of it appears in a throughput chart, because none of it is production. It is the cost of keeping what was produced.
measuring output rewards whoever produces the most of it
When writing was expensive, volume was a reasonable proxy for effort. It is not one any more. The scarce input is no longer production, it is judgment — knowing what to build, what to keep, what to throw away, and where a person still has to be the one deciding.
The industry spent forty years learning not to count lines. Then it started counting again.
For four decades the industry agreed that counting lines was a poor way to measure software. It rewards volume, and the engineers you most want to keep are the ones who remove volume. A rewrite that deletes two thousand lines and a feature that adds two thousand score as opposites, when the first is often worth more. The argument was settled and the metric was retired.
Then AI arrived and the same number came back wearing a new name. Share of code written by AI. Tokens consumed. Suggestions accepted. Pull requests merged. Every one of them counts the act of writing, and that too at the exact moment writing stopped being the expensive part. A metric that was merely gameable when a human had to type it is unbounded when a machine does.
So there is a great deal to account for now, and no single instrument reaches all of it. We use telemetry to establish what happened, and we ask people directly where the answer only exists in their heads. Then the part that actually decides the outcome: every organisation adopts this differently enough that a reading taken from one does not transfer to another.
Scientifically curated, and built to measure what actually determines the outcome rather than what happens to be easy to count.
Computed from what gets rewritten, what drags review, what compounds as complexity, and what nobody can account for three weeks later. Priced, so it can be argued about in a budget meeting rather than a retro.
Up from 24 before assisted authoring
Priced
$412k
per quarter
Read from the work itself: the rejections, the redirections, the designs that were thrown away before they cost anything. It is the only one of our numbers that goes up when people think harder, and it cannot be gamed by producing more.
Of human review changed direction, not syntax
Avoided
$780k
per quarter
Growth ships fastest and thinks least. That is the finding, and no throughput chart contains it.
Delivery measured end to end, from the moment work is picked up to the moment a customer can use it, with the time each stage actually consumed.
Each of these is a decision already being made, usually without the evidence to settle it.
See exactly how AI and engineering effort maps to the initiatives you care about, so leaders can confirm investment is flowing to the highest-priority work, not just the loudest.
Tie AI costs and engineering activity directly to shipped outcomes. Know what your AI adoption is actually delivering, and whether it's genuinely accelerating how fast you ship.
Design flexible metrics spanning delivery, investment, and day-to-day workflows, with AI that reads the data for you and highlights what deserves attention next.
See how engineers actually prompt, iterate, and weave AI into the development lifecycle. Spot the patterns and habits that reliably lead to better results, and spread them across teams.
Capture structured feedback from your engineers to pinpoint what's slowing them down, then act on it to lift productivity and satisfaction.
Replace manual time tracking with automated, audit-ready reports for software capitalization and R&D tax credits.
AI adoption in SDLC workflows is near-universal, but most organizations have no way to study how it is impacting their software. That gap is not a tooling problem. Every organization has different constraints, and no single metric can tell you how yours is performing. We are researchers and practitioners with more than a decade in developer productivity and software engineering. Closing that gap is our work.
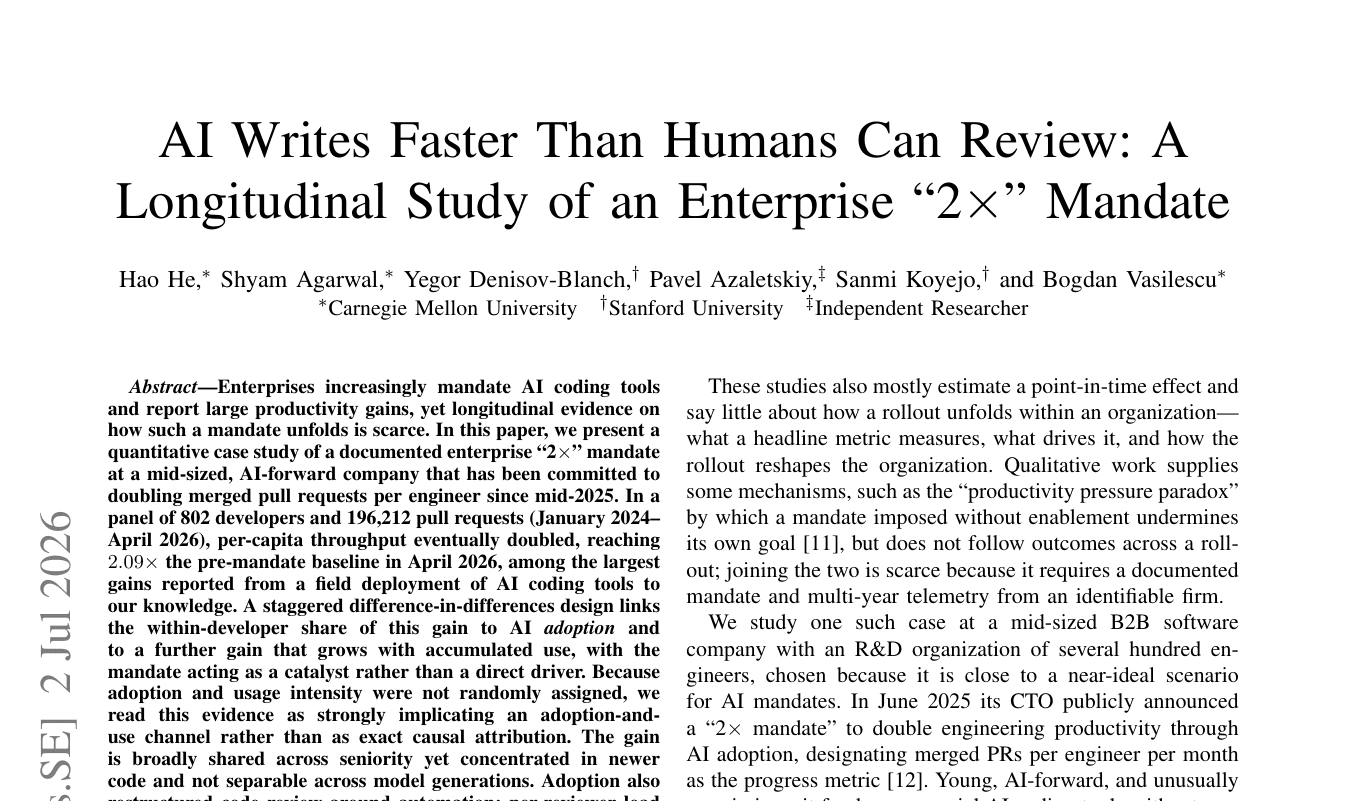
The mandate to double merged pull requests worked. Reviewer load roughly doubled with it.
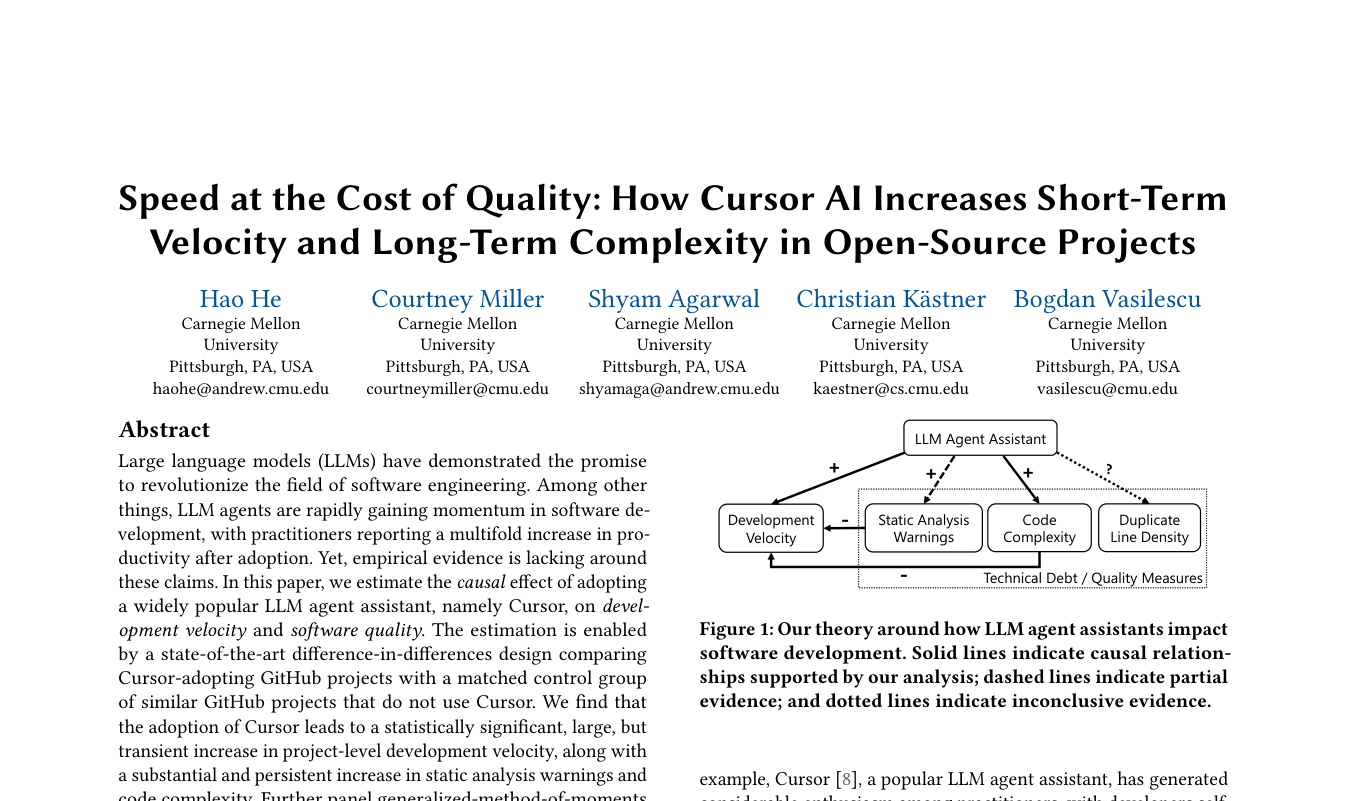
A large but transient velocity gain, alongside a persistent rise in complexity that drove the later slowdown.
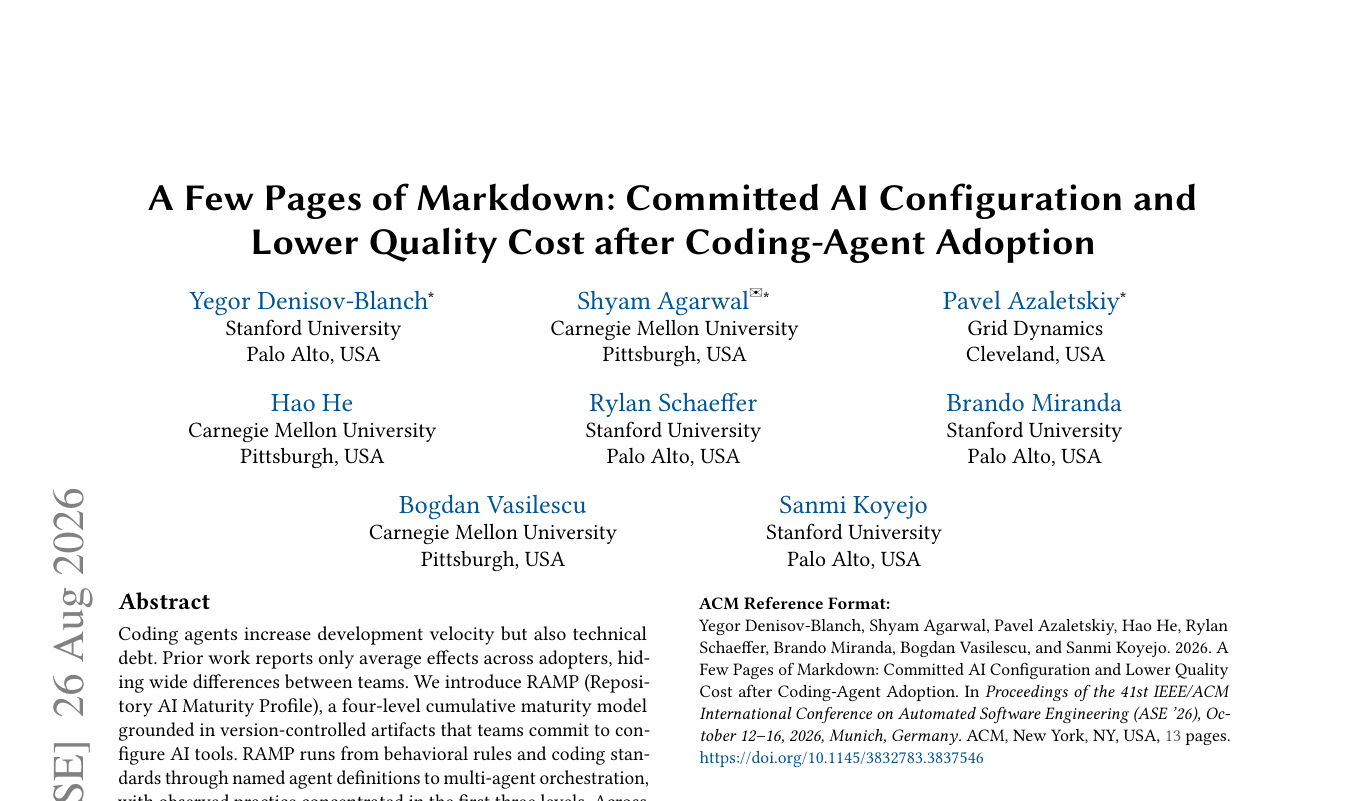
Averages across adopters hide wide differences between teams. Repositories without committed AI configuration showed roughly twice the rise in cognitive complexity.
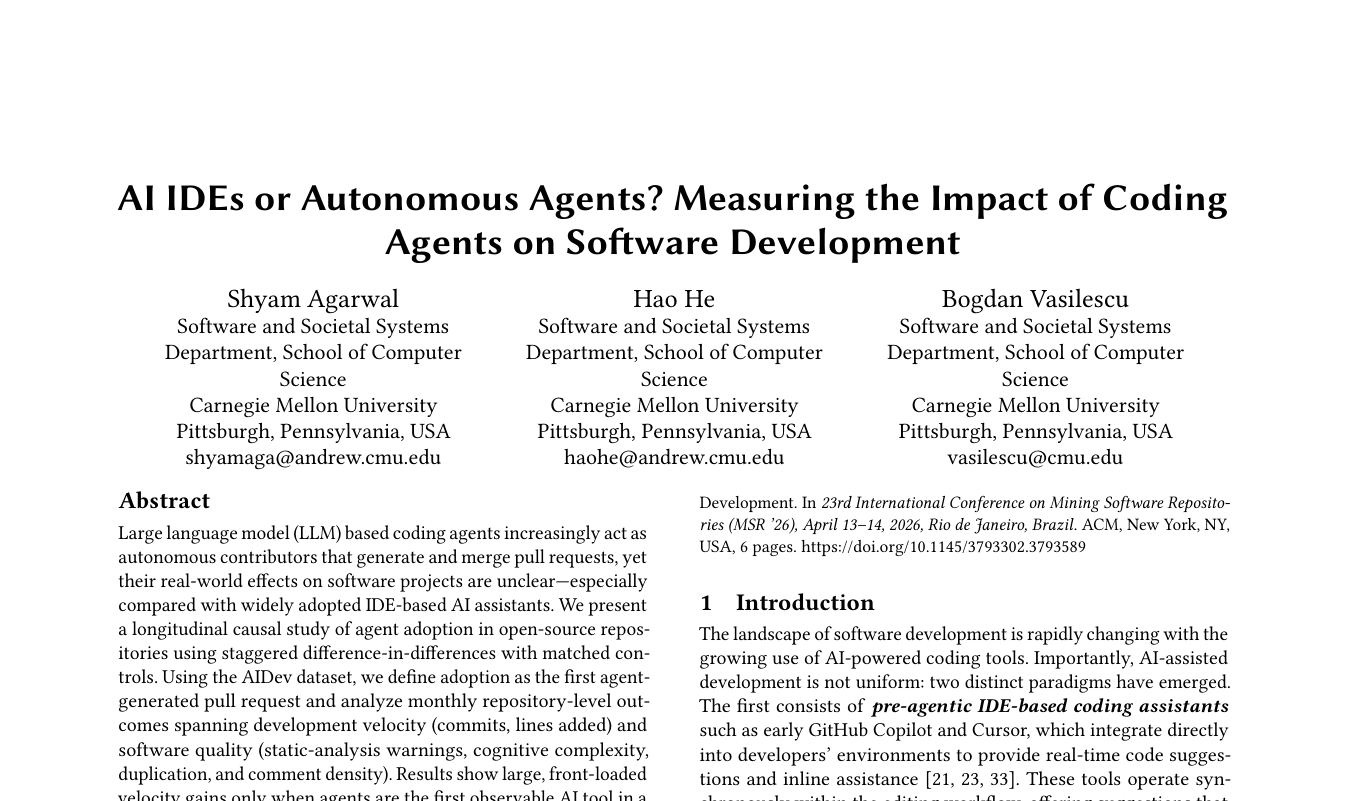
Agents and IDE assistants are not the same intervention and do not carry the same cost.
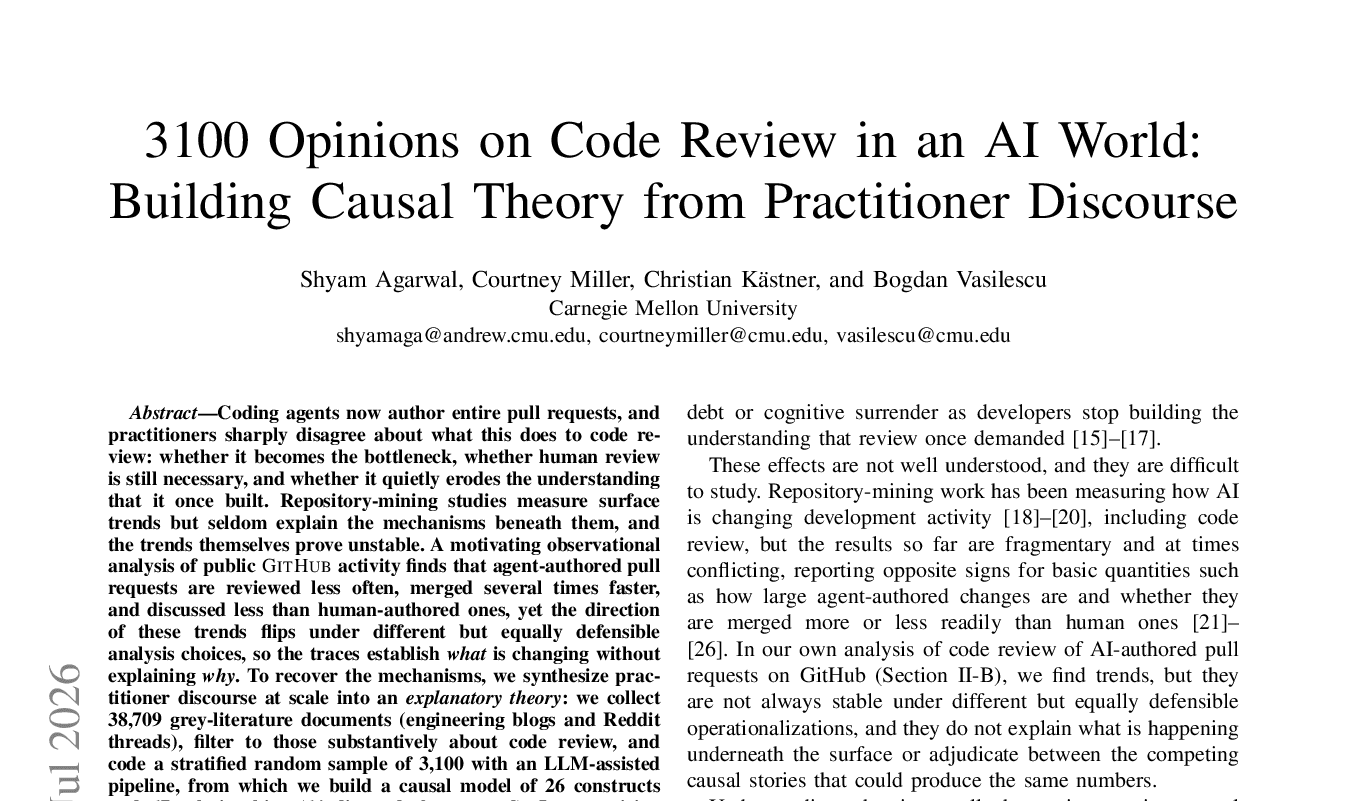
Agent-authored pull requests are reviewed less often and merged several times faster, yet the direction of those trends flips under equally defensible analysis choices.
We're working with a small number of engineering organizations to get this right. Connect a repository and see your own numbers.